
A board that worked on Friday comes back on Monday with a silent UART and a debugger that refuses to connect. The source has not changed, but that rarely stops anyone from spending an afternoon editing it. Wiring mistakes, marginal power, and timing problems produce symptoms that look exactly like software bugs, and they are usually cheaper to rule out than to chase in the source. Work the physical layer first.
Power, Reset, and Boot Pins
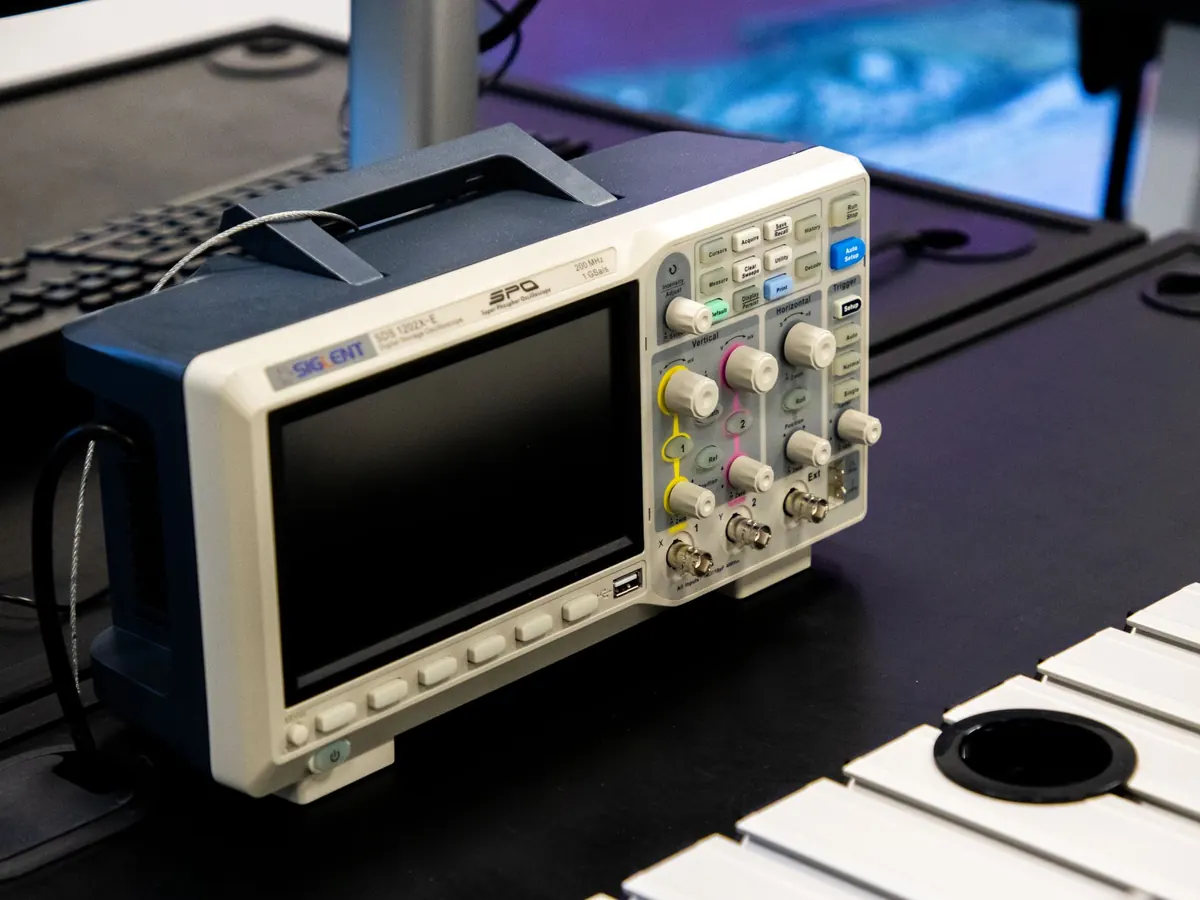
Measure the rails under load, not at idle. A 3.3 V supply that reads a clean 3.31 V with the radio off can sag below the brownout threshold the moment a transmitter or a motor driver pulls current. Clip a scope probe to the rail and trigger on a falling edge while the device does the thing that fails. If you see a dip, you have your answer, and no amount of refactoring will fix it.
Then look at reset. An NRST pin left floating, a stray capacitor holding it low, or a supervisor chip with a slow release can produce a target that boots sometimes and not others. Confirm the boot and strapping pins sit at the levels you expect. A floating BOOT0 pin on many parts drops the chip into the system bootloader, which means the firmware you are debugging is not running at all.
Clock and Startup
If the external crystal fails to start, plenty of parts quietly fall back to an internal RC oscillator. The code runs, but every derived clock is wrong, which breaks UART baud rates, SPI timing, and anything with a delay loop. Never assume the clock tree is what your configuration file claims.
A quick check that costs nothing: toggle a spare GPIO at the top of a tight loop or a timer interrupt, and measure it on the scope. If you configured a 1 kHz tick and you measure 780 Hz, the clock source is not what you think it is. Load capacitors, a cold solder joint on the crystal case, and a wrong PLL multiplier all show up here.
UART Is the Cheapest Debug Channel
Before reaching for the probe, get one byte out of the target. UART is forgiving, needs no special hardware, and works when the debug interface does not. The failures are almost always electrical or arithmetic:
- TX and RX swapped — a classic, and worth checking twice.
- No common ground between target and adapter.
- 3.3 V logic driving a 5 V-only receiver, or the reverse.
- Baud rate error above roughly two percent, usually from a wrong peripheral clock assumption.
- A blocking printf inside an interrupt handler filling the FIFO and dropping bytes.
Print one line before any initialization runs, at a slow baud rate like 9600. If that works and a faster rate does not, the problem is clock accuracy, not your parser. In production code, use a ring buffer and a non-blocking transmit path, or you will spend a week chasing corrupted log output.
SWD: Assume the Connection Before the Code
"Cannot connect to target" is a wiring message, not a firmware message. SWD needs only SWDIO, SWCLK, ground, and often a voltage-sense line back to the probe. Check that the pull-up on SWDIO is present, that the pins are not repurposed as GPIOs by your own initialization code, and that no low-power mode has shut the debug interface down. Many parts expose a debug freeze register that keeps the clock alive through sleep — set it while you work.
Breakpoints and faults
Two traps catch people repeatedly. First, if the core halts inside a HardFault, read the stacked program counter, link register, and status register from the exception frame instead of sprinkling breakpoints and hoping. The faulting address is right there.
Second, hardware comparators are limited to a handful, and software breakpoints patched into flash can be erased by a flash write during the debug session. If your breakpoint never triggers, verify which kind the tool actually placed. Watchdogs deserve the same suspicion: halting the core does not stop the watchdog, so the target may reset under you while you inspect a variable. Disable it or configure debug-halt freeze during development.
Logic Analyzer: For Questions SWD Cannot Answer
A debugger tells you what the core thinks. A logic analyzer tells you what the wires did. Reach for it when a bus is involved:
- Sample fast enough — at least five to ten times the fastest edge in the system. A 10 MHz SPI clock needs a 50 MHz or better sample rate.
- Keep the ground lead short. A long clip on a fast clock shows ringing and overshoot that exist only in your probe.
- Trigger on the failure, not on the start. Chip-select falling edge, a missing ACK on I2C, or a GPIO you raise at the top of the interrupt handler.
- Trust edges over decoders. Protocol decoders are convenient summaries; they will happily report a frame that the waveform contradicts.
Instrumentation pins deserve more use than they get. Toggle a spare GPIO on entry and exit of an ISR, set another high when a buffer overflows, pulse one when a task misses its deadline. Suddenly timing arguments become measurements. This is often faster than getting a full trace toolchain working.
An Order of Operations That Saves Time
- Rails under load, reset line, boot pins.
- Clock source actually running at the expected frequency.
- One UART byte at a slow baud, printed before initialization.
- SWD connect under reset, at a reduced clock speed.
- Logic analyzer on the failing bus, triggered on the failure.
- Instrumentation pins for anything about timing.
- Only now, open the source file.
Before You Rewrite the Code
Rewriting discards working parts along with the evidence. Save the known-bad binary, keep the scope capture, and note the commit hash. Reproduce the fault with the smallest firmware you can build, then change one variable at a time. If a rewrite appears to fix the problem, flash the old binary again and check whether it still fails — sometimes a rebuild, a reseated connector, or a recharged battery was the real fix, and you will want to know which before the next board arrives.
Photo: Ludovic Delot / Pexels